Plotly

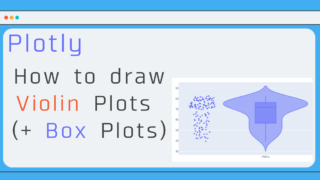
Plotly : How to draw Violin Plots (+ Box Plots)

 In this article, I'll show you how to draw a Violin Plot (violin diagram) using go.  What is a violin plot anyway? In t...
Plotly

Plotly : How to Draw Sunburst Charts ~ The Definitive Guide to Pie Charts! ~

 In the previous article, we summarized how to draw a pie chart. Unlike other graphs, the basic elements of a pie chart ...
Plotly

Plotly How to draw “Pie Chart”

 In plotly, graphs are intuitive and easy to use, and the pie chart, which is the subject of this article, is one of th...
Plotly

Plotly Heatmap (visualize the correlation matrix as a heatmap)

 Let's visualize the correlation matrix! This is the first time I've used a correlation matrix. By the way, if you repr...
Plotly

What is Plotly Express? (Summary of graphs you can draw)

 There are two ways to import graphs in plotly: graph_objects and Express. For more information, see What is Plotly grap...
Plotly

What is Plotly graph_object? (How is it different from Express?)

 When drawing graphs in Plotly, if you read the documentation or read about it in various articles, you may wonder what ...
Plotly

Plotly : How to draw Lineplots ?

 In Plotly, you can use the Scatter function to draw a LinePlot! This can be done by setting the option mode to "l...
Plotly

Setting the mode for Plotly Scatter (scatter and line graphs)

 In Plotly, you will probably use Scatter the most when drawing graphs. In this article, I will introduce Scatter.Scatt...
Plotly

Plotly : Save graphs as images and html (write_img, write_html)

 We have written articles on how to write graphs, but there will come a time when you will want to save your graphs!  ...
Plotly

Plotly Multiple Axes by make_subplots

 There are times when you want to use multiple axis labels instead of just one. Here is a summary of how to use it, wit...
Copied title and URL