In Plotly, you will probably use Scatter the most when drawing graphs. In this article, I will introduce Scatter.Scatter can be directly translated as scatter plot. But in fact, by switching the mode, you can also draw line graphs! If you consider that you can also draw bubble charts, area charts, etc. by changing the settings, you can see that Scatter has a large range of coverage! In this article, we will discuss how to set the Mode in the Scatter options, and how to display text as well!
Scatter Plots / Line Plots
As for the Scatter option, three things to keep in mind are the following.
- mode = "lines" : Line Plots
- mode = "markers" : Scatter Plots
- mode = "text" : Display text ("text" is explained in the next section)
For more information on how to draw graphs, see How to write Plotly common graphs!(add_trace,update_layout), A list of graphs you can draw with Plotly! , we introduced that the basic scatter plot can be drawn with the code below!
Then, on line 6, there is an option called mode, and I'll summarize the options here.
import plotly.graph_objects as go
fig = go.Figure() #1

fig.add_trace(    #2. Add and describe a graph
    go.Scatter(x = "x-value", y = "y-value",
                  mode = [mode], # 'lines','marker',...
                  name = [label])
)

fig.show() #4.Draw a graph
Line Plots (lines)
mode = 'lines'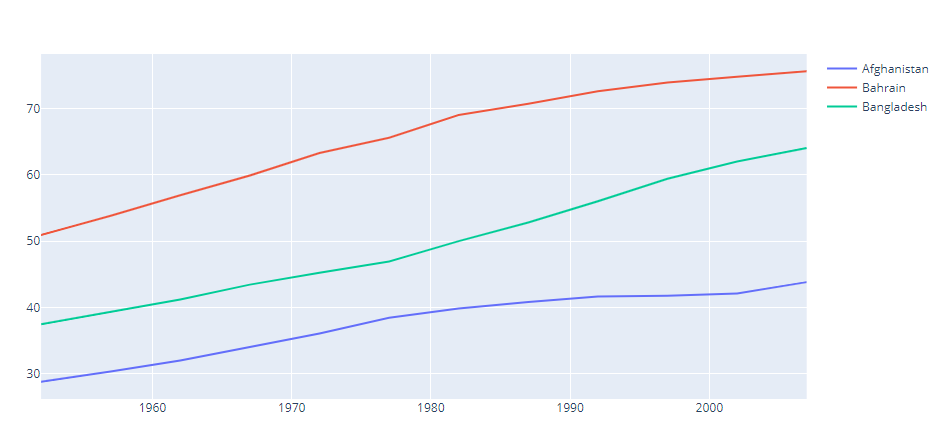
Scatter Plots (markers)
mode = 'markers'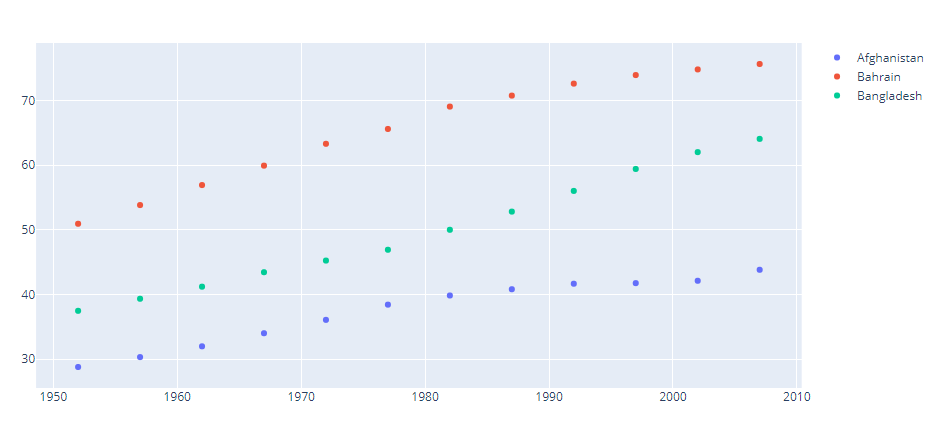
Line graph with plot (lines + markers)
So far, we have introduced two modes, lines and markers, for plotting lines and points, respectively. In other words, if you want to show plot points while drawing a line, you can combine lines and markers and set it as 'lines + markers'!
mode = 'lines+markers'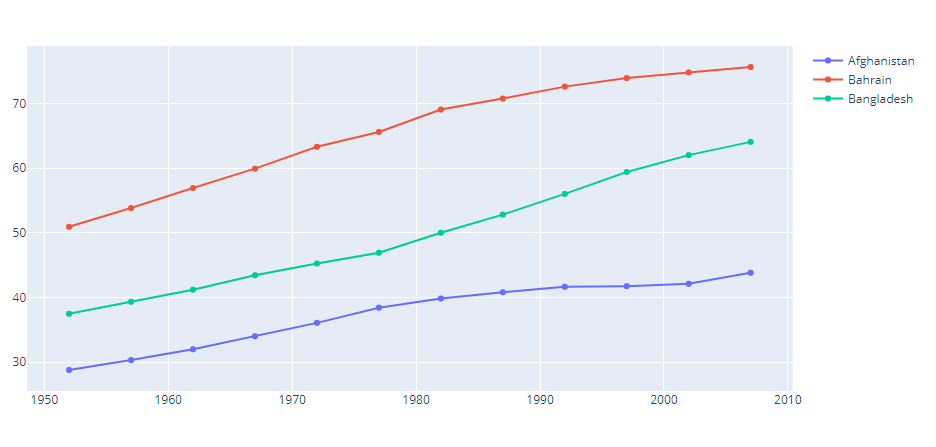
Sample Code
import plotly.graph_objects as go

# Data Preparation
import pandas as pd
import plotly.express as px
df = px.data.gapminder()
asia_df = df[df['continent']=='Asia']
# Draw a graph
fig = go.Figure()
for country in  asia_df['country'].unique()[:3]:
    plot_df = asia_df[asia_df['country']==country]
    fig.add_trace(
        go.Scatter(x = plot_df['year'],
                   y = plot_df['lifeExp'],
                  name = country,
                  mode = 'lines' # Change the mode in this section!
        )
    )
fig.show()
Add text to the graph!
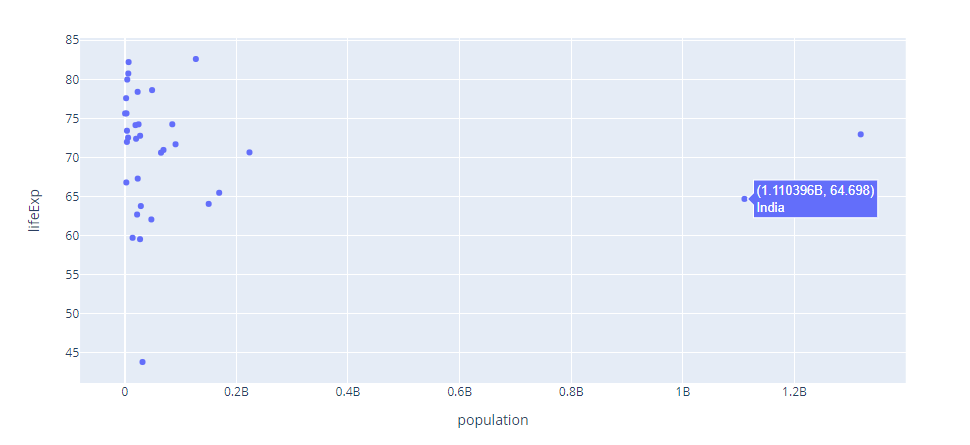
A scatter plot of Asian countries and regions, with population data on the horizontal axis and life expectancy on the vertical axis, and mode = 'markers', is shown below!
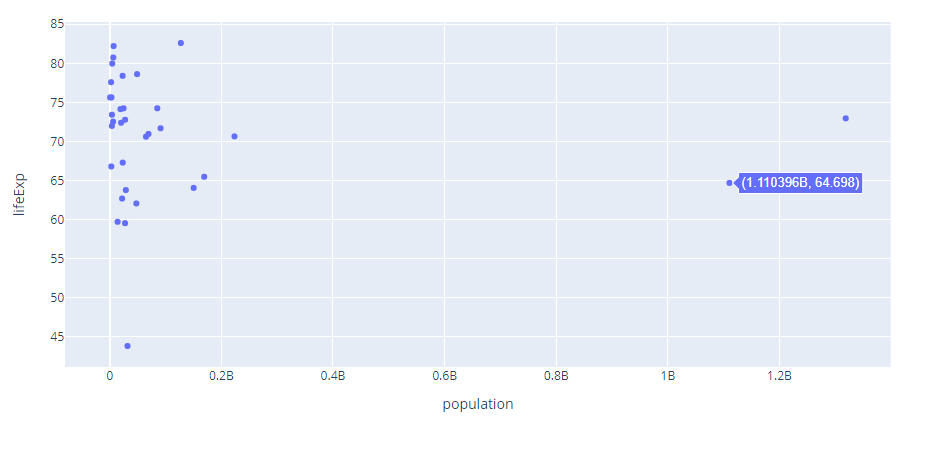
It's hard to tell which country it is, isn't it? By the way, if you want to find out which country is (1.110396B.648) in the above diagram, how do you do it?
In Plotly, there are two ways to do this, and we'll talk about each!
<Completion target diagram>
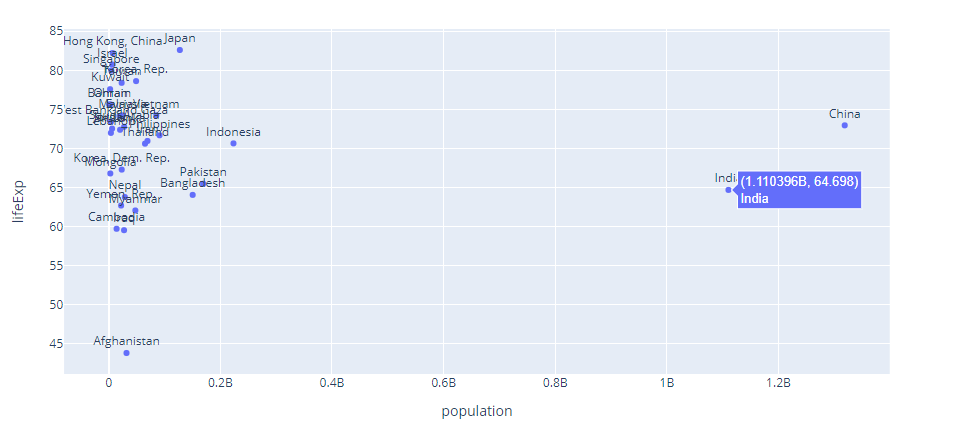
Optional : Text
In the go.Scatter function, there is an optional Columns and elements to be displayed
text = "Columns and elements to be displayed"By doing the above, the column/element you set as text will be displayed when you hover over it. To display it in a graph, you can combine it with the previous mode using "+text"!
Display on graph
To display it in a graph, you can combine it with the previous mode using "+text"!
mmode = 'markers+text' #Example
Option to set the display position (textpositon)
In the same go.Scatter() function, you can set the textposition to determine where the text you set above will be displayed from the point of view.
textposition="top center"
textposition="bottom center" 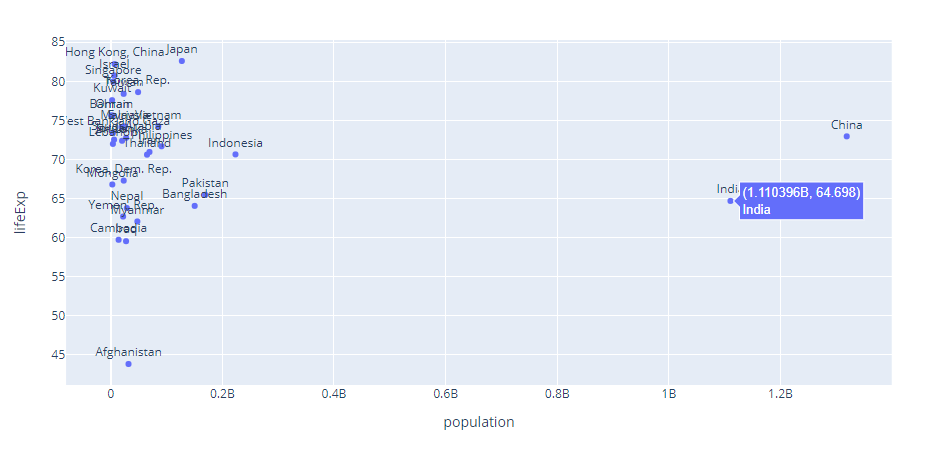
Sample Code
import plotly.graph_objects as go

# Data preparation
import pandas as pd
import plotly.express as px
df = px.data.gapminder()
asia_df = df[df['continent']=='Asia']
asia_2007_df = asia_df[asia_df['year']==2007]

# Draw a graph
fig = go.Figure()
fig.add_trace(
    go.Scatter(
        x = asia_2007_df['pop'],
        y = asia_2007_df['lifeExp'],
        mode = 'markers+text',
        text =  asia_2007_df['country'],
        textposition="top center"
    )
)
fig.update_layout(
    xaxis_title = 'population',
    yaxis_title = 'lifeExp'
)

fig.show()