2021-10

Plotly

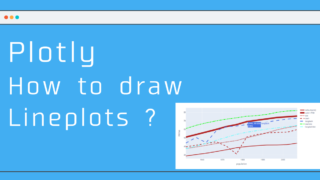
Plotly : How to draw Lineplots ?

 In Plotly, you can use the Scatter function to draw a LinePlot! This can be done by setting the option mode to "l...
Plotly

Setting the mode for Plotly Scatter (scatter and line graphs)

 In Plotly, you will probably use Scatter the most when drawing graphs. In this article, I will introduce Scatter.Scatt...
Plotly

Plotly : Save graphs as images and html (write_img, write_html)

 We have written articles on how to write graphs, but there will come a time when you will want to save your graphs!  ...
Plotly

Plotly Multiple Axes by make_subplots

 There are times when you want to use multiple axis labels instead of just one. Here is a summary of how to use it, wit...
Plotly

Plotly Display multiple graphs side by side (make_subplots, set_subplots)

  In this article, I will explain how to use subplots in matplotlib.  In matplotlib, the function can be represented by...
Plotly

How to write a common Plotly graph! (add_trace,update_layout)

In previous articles, I introduced how to use a simple visualization library called Plotly (Plotly makes graphs easier...
Plotly

List of graphs you can draw with Plotly!

 In the previous (Plotly makes your graphs easier to use !), we explained what Plotly is, a very useful visualization l...
Plotly

Plotly makes your graphs easier to use !

   When writing graphs in python, what library do you use?matpltlib ? seaborn ? etc., but this time I'll introduce Pl...
Copied title and URL