2021-12

Plotly

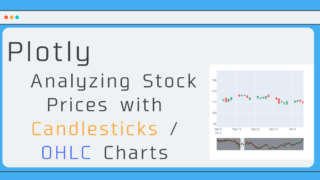
Plotly : Analyzing Stock Prices with Candlesticks / OHLC Charts

 So far, I have been writing articles on points that are important to remember when plotting time series data. In this a...
Plotly

Plotly Cheatsheet (graph_objects)

 Plotly allows you to draw graphs in a clean and intuitive way, but do you ever look up how to draw a graph?  But do you...
Plotly

Time Series Data | How to switch between frequently used analyses with a button! (Range Selector)

 In time series analysis, you want to check the trend in this range in particular! I'm sure you have a range that you wa...
Plotly

Plotting time series data (Plotly) + range slider function

 In this article, I will briefly summarize the illustration of time series data, and then summarize it as "Plots fo...
Plotly

Plotly : Display tables and figures side by side! (left, right, up, down)

 This is the third article in a series on writing tables in Plotly! Here is a summary of the previous articles. How to ...
Plotly

Plotly : How to display Table (Figure Factories)

 In a previous article, I summarized how to draw a table in Plotly using "graph_objects". (Plotly : How to dra...
Plotly

Plotly Course ~ Table of Contents and Summary ~

 If you were to write a graph in python, what would you use?Most people use "matplotlib", but it basically just display...
Plotly

Plotly : How to draw a table (go.Table)

 When I saw the title, I thought Plotly was a library for drawing graphs, but what does it mean for drawing tables? Didn...
Copied title and URL