In the previous (Plotly makes your graphs easier to use !), we explained what Plotly is, a very useful visualization library. In this article, I will explain how to use Plotly, including a simple example!
In this article, we'll continue with a summary of what kind of graphs can be drawn with Plotly. We'll also continue with a summary of what kind of graphs can be drawn with Plotly. We'll write a separate post on how to draw each graph and the options available, so please read that as well!
Basic Structure
Basically, in Plotly, you can change the graph to be drawn by changing the part after "Scatter" after go. in the second line to a name that matches the graph!
(There are multiple notations for the code, but we'll use the code below as a base for our summary)
import plotly.graph_objects as go

fig = go.Figure(data=go.Scatter(x="x-values", y="y-values"))

fig.show()
List of graphs
1. Scatter Plot
- Description after "data"
go.Scatter(x="x-values", y="y-values", mode = "markers")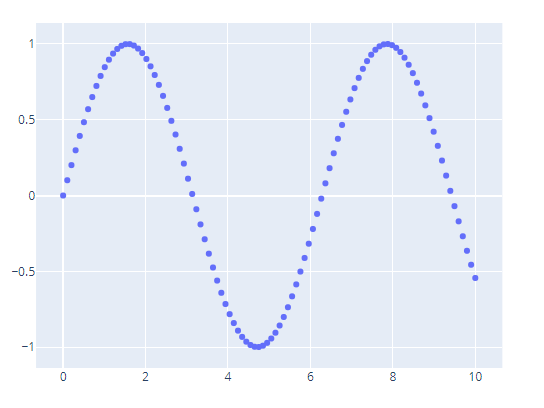
- Bubble Charts
It can be drawn by specifying the marker_size, which is the size of each plot point!
import plotly.graph_objects as go

fig = go.Figure(data=[go.Scatter(
    x=[1, 2, 3, 4], y=[10, 11, 12, 13],
    mode='markers',
    marker_size=[40, 60, 80, 100])
])

fig.show()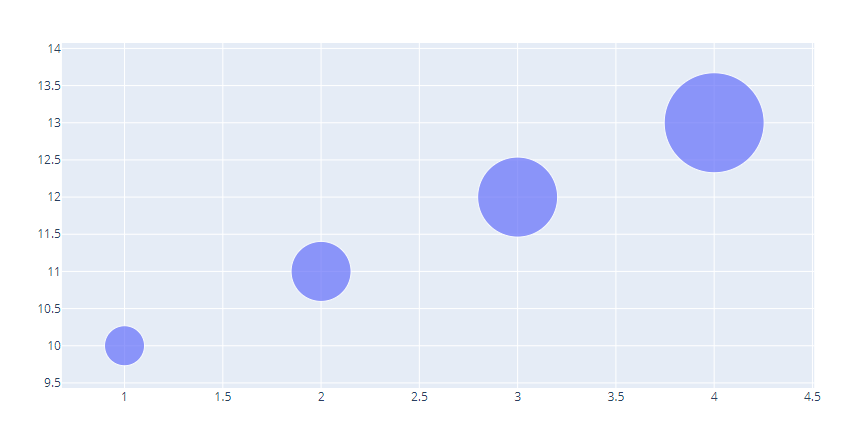
- Filled Area Chart
Optionally, you can specify fill = "tozeory"
go.Scatter(x="x-values", y="y-values", fill = "tozeory")
2. Line Plot
- Description after "data"
go.Scatter(x="x-values", y="y-values")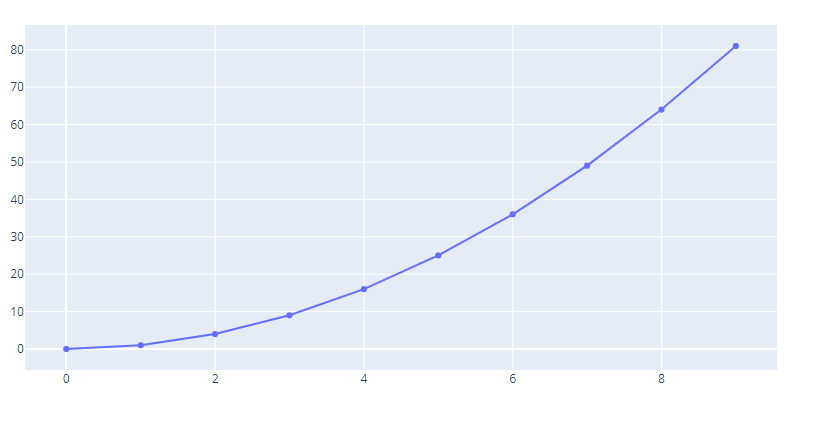
For more information on how to draw a line graph, see the article below!
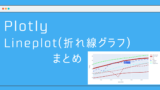
3. Bar Chart
- Description after "data"
go.Bar(x="x-values", y="y-values")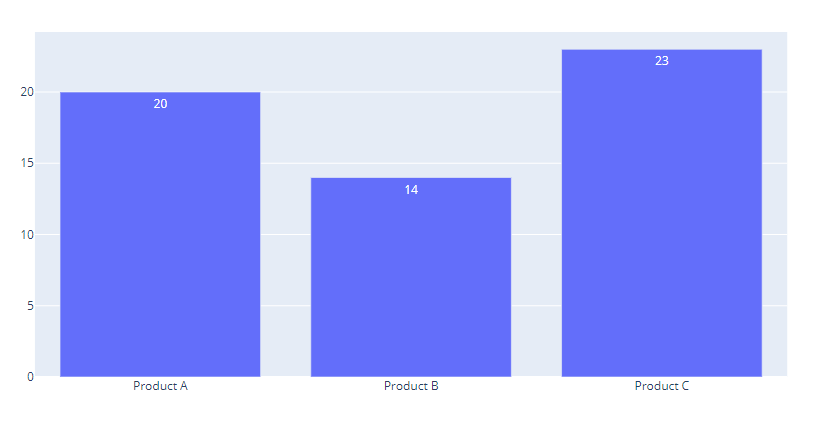
- Horizontal bar chart
Optionally, add orientation = 'h'
4. Pie Chart
- Description after "data"
Since this charts does not have the concept of x,y coordinates, we will specify labels and their corresponding values.
go.Pie(labels="List of labels to be classified", values="A list of values")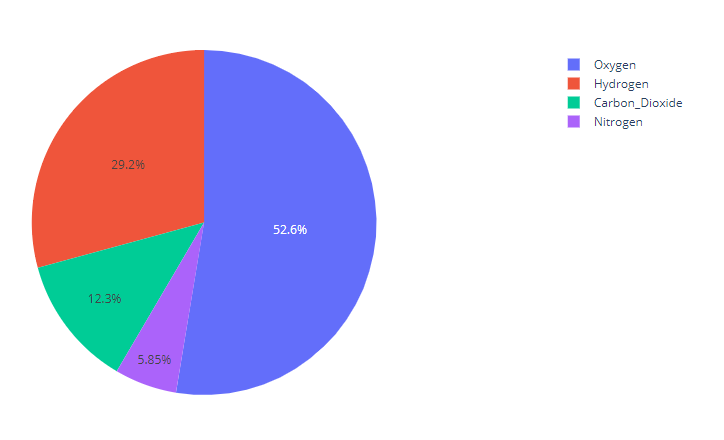
Click here for detailed instructions on how to draw a pie chart!
5. Sunburst Charts
The diagram that impressed me the most when using Plotly (you can combine multiple pie charts!!)
When you select an element, the child elements are displayed as a pie chart with that item at 100%.
- Description after "data"
go.Sunburst(labels = "ラベルのリスト",parents = "ラベルに対応する親の要素のリスト", values="値")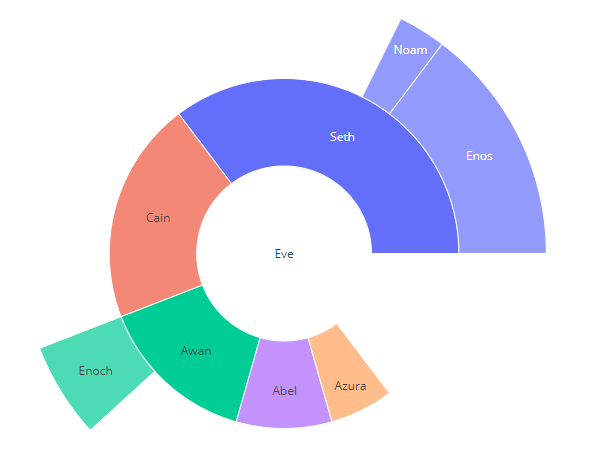
For detailed instructions on how to draw Sunburst diagrams, click here!
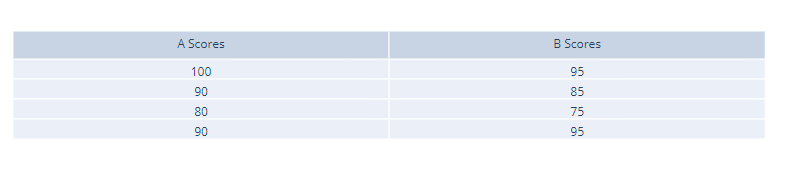
6. Tables
- Description after "data"
Enter the header and cell interior (cells) as dictionary types, respectively
go.Table(header=dict(values="header as a one-dimensional array"),
         cells=dict(values="Values in a two-dimensional array"))
                     ]
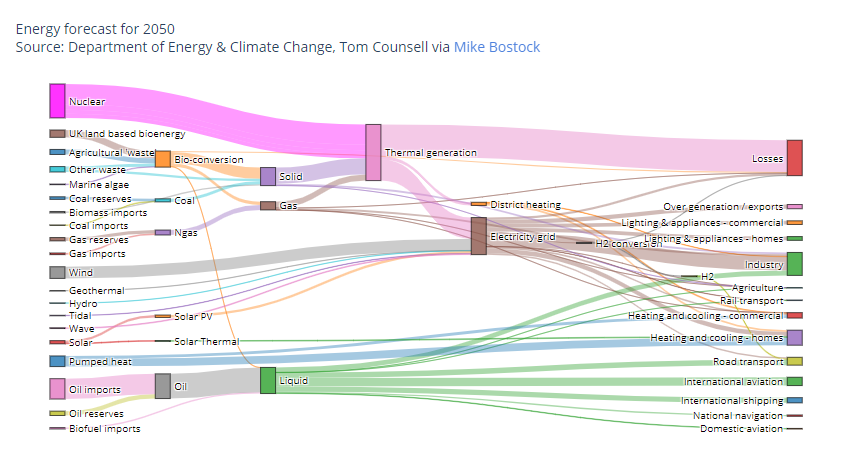
7. Sanky Diagram
- Description after "data"
# sample (https://plotly.com/python/sankey-diagram/より)
go.Sankey(
    node = dict(
      pad = 15,
      thickness = 20,
      line = dict(color = "black", width = 0.5),
      label = ["A1", "A2", "B1", "B2", "C1", "C2"],
      color = "blue"
    ),
    link = dict(
      source = [0, 1, 0, 2, 3, 3],
      target = [2, 3, 3, 4, 4, 5],
      value = [8, 4, 2, 8, 4, 2]
  ))
8. Treemap Chart
- Description after "data"
go.Figure(go.Treemap(
    labels = "List of labels",parents = "A list of parent elements corresponding to the label"
)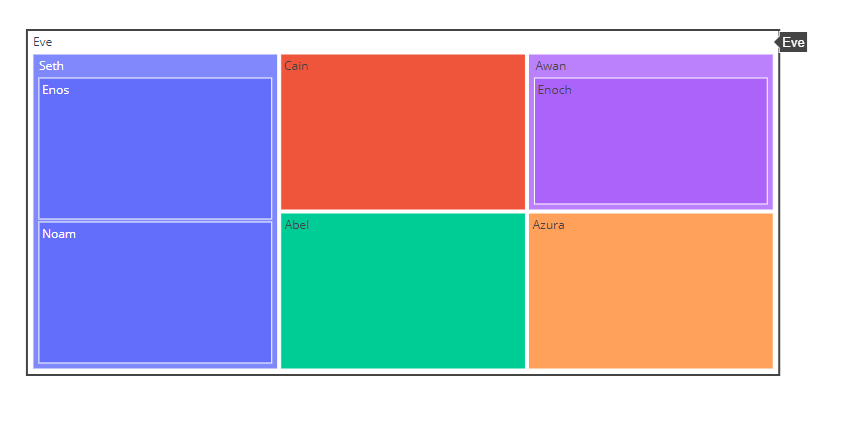
Learn how to draw Treemap Charts from the article below!
9. Violin Plot
Violin Plot is a way to visualize the distribution of numerical data.。
go.Figure(go.Violinplot(
    y = "List of values to be displayed"
)
Learn how to draw a Violin plot from the article below!