In the previous article, we summarized how to draw a pie chart. Unlike other graphs, the basic elements of a pie chart are not the x and y axes, but the element label and its value. In this article, I will summarize the "Sunburst Chart", a chart that you should master to make better use of graphs in plotly. By being able to use this, you will be able to "combine complex pie charts and multiple pie charts into one !

What is Sunburst charts ?
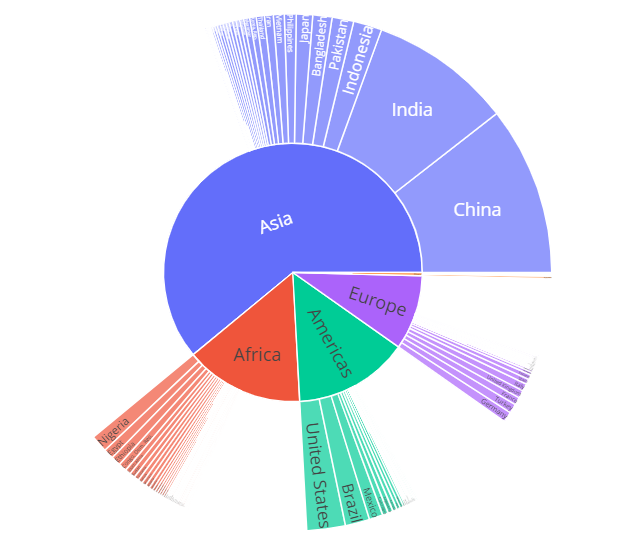
A Sunburst diagram is one of the hierarchical type of graphs. In this article, I will use the population by country graph below as an example. In this graph, the inner circle is divided by continent/region, and the outer circle is divided by country. In this way, there is a parent (root) element in the center, and the pie chart that expresses the children in a hierarchical manner is called a Sunburst diagram, which can be used to combine elements with hierarchies into a single pie chart.
However, one of the disadvantages of combining elements into a single pie chart is that the lower the level, the smaller the area occupied, and the harder it is to see. In fact, how many countries in Europe can you see in the graph below? Even looking at 10 countries seems like a daunting task, but Plotly can solve it!
Click on the Europe part of the inner graph. By doing so, I was able to draw a pie chart with the total population of Europe as 100%! It's easy enough to see the ten countries in this state!
When you want to go back, click on Europe in the middle to go back to the original Sunburst diagram, so you can easily check it later, no matter how many levels you have!
How to draw a basic Sunburst diagram
The minimum elements required for a pie chart are labels and values, and I wrote the following.
go.Pie(labels="List of labels to be classified", values="list of values")In the Sunburst diagram, you need to specify the parent element (label) in addition to that, so the minimum structure is as follows.
go.Sunburst(labels="List of labels to be classified",
      parents="list of parent's value",
      values="list of values")
The difference between this and a pie chart is that you need a column with a parent label, and you need to define the root element. It's not difficult to do, so I'll explain it in order using an example !
① Define the data frame for drawing
# Create a df with label, parents, and value (in this case, pop(population) is the value we want to draw in the graph)
df = pd.DataFrame(columns={'labels','parents','pop'})
② Definition of roots
Group the parent elements together using groupby, and do not set anything for the top-level element's parents (assign "")
# Organize parent elements by groupby
df_2007_continent = df_2007.groupby('continent').sum().reset_index()
# Do not set anything to the top-level element's parents (assign "")
df_2007_continent['parents'] = ""
# Rename the continent column as label to labels and join it to the df for drawing.
df_2007_continent = df_2007_continent.rename(columns={'continent':'labels'})
df = pd.concat([df,df_2007_continent[['labels','parents','pop']]])
③ Definition of the child element
If it's not the lowest layer, do gropuby to get the sum and add it to the df for drawing, if it's the lowest layer, rename it to fit the df and concat it to the df.
# Rename the country column to labels and the continent column to parents, and merge them into a df for drawing.
df_2007 = df_2007.rename(columns={'country':'labels','continent':'parents'})
df = pd.concat([df,df_2007[['labels','parents','pop']]])
How to draw a Sunburst chart Application
branchvalues (setting the width of a child element)
-
total (see the graph given in the example here) The width of a child element is determined solely by the percentage of the parent element it contains (the parent's width is the sum of the child's widths).
-
remainder (default) The width of the parent is the sum of the widths of the children plus the width of the parent, that is, the sum of the widths of the children is at most half the width of the parent. By the way, if you draw the above graph by default, it will look like the figure below.
Sample code
The following is a summary of what we have done so far in the code.
import pandas as pd
import plotly.express as px
import plotly.graph_objects as go

# Data preparation
df = px.data.gapminder()
df_2007 = df[df['year']==2007]
df_2007_continent = df_2007.groupby('continent').sum().reset_index()

# Create a data frame that clarifies parents (parent-child relationships).
df = pd.DataFrame(columns={'labels','parents','pop'})
df_2007_continent['parents'] = ""
df_2007_continent = df_2007_continent.rename(columns={'continent':'labels'})
df = pd.concat([df,df_2007_continent[['labels','parents','pop']]])
df_2007 = df_2007.rename(columns={'country':'labels','continent':'parents'})
df = pd.concat([df,df_2007[['labels','parents','pop']]])

fig =go.Figure(go.Sunburst(
    labels=df['labels'],
    parents = df['parents'],
    values = df['pop'],
    branchvalues="total",
))

fig.show()