In this article, I will explain how to use subplots in matplotlib.
In matplotlib, the function can be represented by subplot, but how do you write the code in plotly? In this article, I will summarize how to write the code in plotly!
make_subplots (basic)
First, let me introduce the basic flow!
➀ Import "make_subplots"
➁Define how many rows and columns to display vertically and horizontally
➂ Define how many rows and columns to place in each graph
➀ Import "make_subplots"
from plotly.subplots import make_subplots➁ Define how many rows and columns to display vertically and horizontally
If you use the make_subplots function, you don't need to initialize it separately in go.Figure
In the example below, a subplot with one row and two columns is created.
fig = make_subplots(rows=1, cols=2)➂ Define how many rows and columns to place in each graph
After describing the graph, the "add_trace" function will ask how many rows? and how many columns.
In the example below, row 1 and column 2 are used.
fig.add_trace(go.Scatter(
    x= theta,
    y= coss
), row=1, col=2)
Sample Code
from plotly.subplots import make_subplots
import plotly.graph_objects as go
import numpy as np
theta = np.linspace(0, 10, 100)
sins = np.sin(theta)
coss = np.cos(theta)
tans = np.tan(theta)
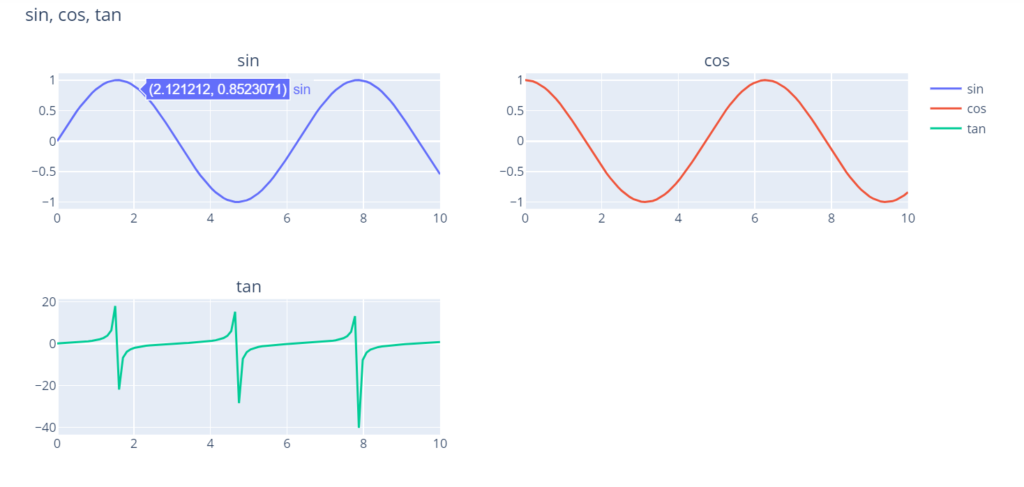
fig = make_subplots(rows=2, cols=2)
fig.add_trace(go.Scatter(
x= theta,
y= sins,
name = 'sin'
), row=1, col=1)
fig.add_trace(go.Scatter(
x= theta,
y= coss,
name = 'cos'
), row=1, col=2)
fig.add_trace(go.Scatter(
x= theta,
y= tans,
name = 'tan'
), row=2, col=1)
fig.update_layout(
title = "sin, cos, tan"
)
fig.show()make_subplots (Option)
There are also many options in make_subplots!
I used some of them to update the above diagram, and I will summarize the options I used here.
subplot_titles
You can use this to give a title to each graph created with subplot!
subplot_titles=("sin", "cos", "tan")row_hights
By default, the size of the graph is uniform, but there are options to change the height of the first and second lines.
In the example below, you can change the size of the first line to 0.7 and the second line to 0.3.
row_heights=[0.7,0.3]column_widths
As with row_heights, the default size of the graph is uniform, but there are options to change the width of the first and second columns.
In the example below, the size of the first row is 0.7 and the second row is 0.3.
column_widths=[0.7, 0.3]shared_axes
As you can see in the graph above, if you have multiple graphs that are written separately but have the same x-axis or y-axis range, you can group them together and display the ticks for the specified axis!
shared_xaxes=True # If x-axis is shared
shared_yaxes=True # If y-axis is shared
Sample Code
from plotly.subplots import make_subplots
import plotly.graph_objects as go
import numpy as np

theta = np.linspace(0, 10, 100)
sins = np.sin(theta)
coss = np.cos(theta)
tans = np.tan(theta)

fig = make_subplots(
    rows=2, cols=2,
    subplot_titles=("sin", "cos", "tan"),
    row_heights=[0.7,0.3],
    column_widths=[0.7, 0.3],
    shared_xaxes=True,
)

fig.add_trace(go.Scatter(
    x= theta,
    y= sins,
    name = 'sin'
), row=1, col=1)
fig.add_trace(go.Scatter(
    x= theta,
    y= coss,
    name = 'cos'
), row=1, col=2)
fig.add_trace(go.Scatter(
    x= theta,
    y= tans,
    name = 'tan'
), row=2, col=1)

fig.update_layout(
    title = "sin, cos, tan"
)

fig.show()
set_subplots
In the article so far, I used "make_subplots" to write the following.
from plotly.subplots import make_subplots
fig = make_subplots(rows = 2, cols = 3)
If you use "set_subplots" as an alternative, you can write something like the following!
import plotly.graph_objects as go
fig = go.Figure().set_subplots(2, 3)
It is introduced as a common structure for graphs, it's good to remember that if you want to write it in the same flow as (Plotly common graphs how to write!(add_trace,update_layout)), you can do it this way too!
Finally
In this article, I have introduced the usage of subplot with sample code. If you'd like to try writing pie charts with subplot other than what I've shown here, please refer to the sample code in the article below!